
I Analyzed 789,362 Substack Notes from April. Here's the Best Time to Post.
Avoid the same mistakes most creators do

Hey everybody! 👋
This article is part of a series where I share what I’ve found across millions of Substack Notes. I don’t have the capacity to write these on my own, so I feed Claude the raw data and it writes the articles. Enjoy.
I analyzed 789,362 Substack Notes from April. Not a sample. The full 30-day window, every original Note, filtered to exclude restacks. One question: does the hour you post actually change how many reactions you get, or is that just scheduling superstition?
It changes. The best-performing hour outperformed the worst by 82%. There’s a specific 3-hour window that looks like a logical time to post, catches a plausible audience, and consistently produces the lowest engagement on the platform, 30% below average. The winning window, the dead zone to avoid, and a weekly posting grid built from the data are all below.
The Hour Curve
Here’s the graph that shows the best times to post:
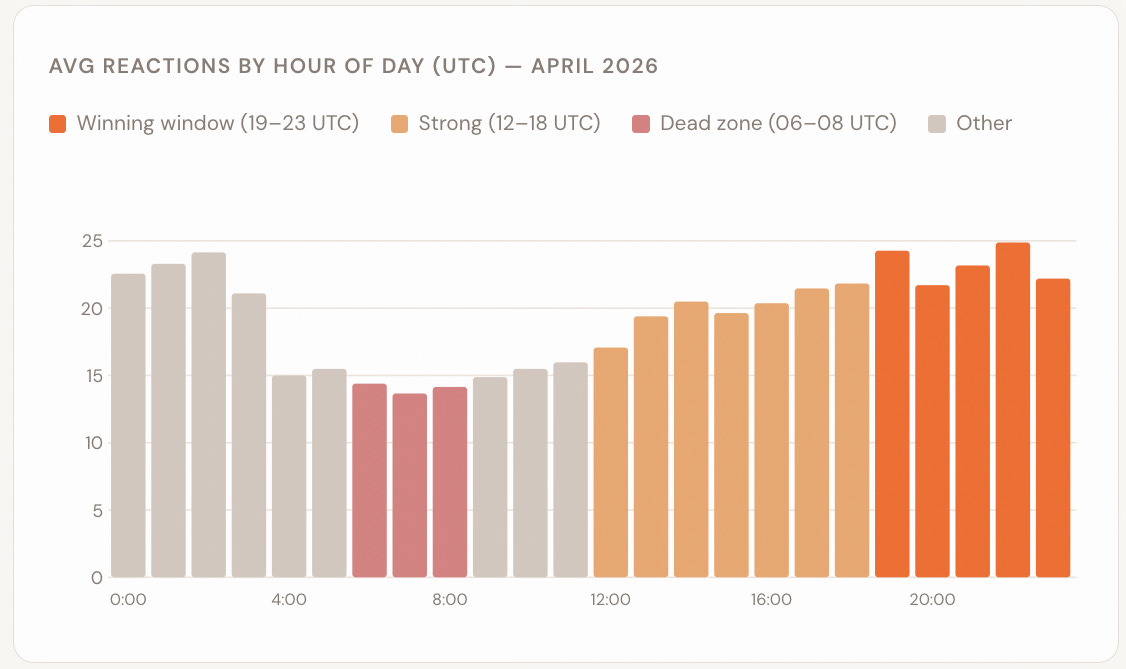
The curve is asymmetric. It climbs from a trough between 04:00 and 09:00 UTC, stabilizes in the afternoon, then surges from 19:00 onward. The 19:00–23:00 UTC window averaged 23.2 reactions per Note, 16% above the platform average. All five hours in that window carried a median of 4 reactions. The dead zone hours dropped to a median of 3.
Two windows overlap here. Hours 19:00–23:00 UTC represent the US afternoon and early evening (EST: 2pm–6pm, PST: 11am–3pm), combined with European prime-time browsing (CET: 8pm–midnight). Two large reader audiences simultaneously active. That overlap is almost certainly why the evening surge is so consistent. Hours 00:00–02:00 UTC also perform well (avg 22.5–24.1) for a related reason: that’s 7pm–9pm US East Coast, when feed activity peaks with lower posting competition.
Volume note
No hour in this dataset is thin. The lowest-volume slot (04:00 UTC) still had 14,990 Notes. Every number in this article is statistically reliable.

Day Breakdown
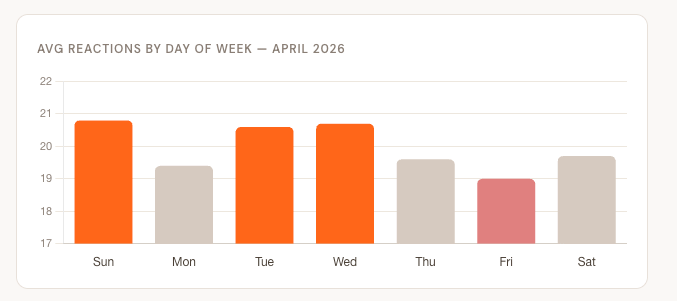
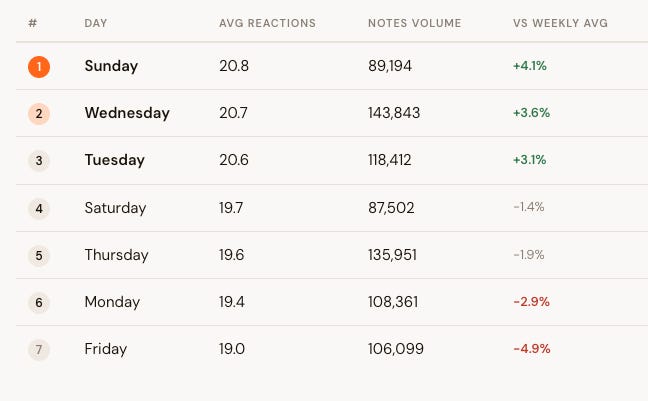
Weekend Notes slightly outperformed weekdays in April (20.25 avg vs 19.86). Saturday and Sunday carry roughly 25% fewer Notes than the busiest weekdays, which means less competition for feed position. That volume gap explains most of the performance edge. Wednesday is the busiest day on the platform by Note count (143,843) and still ranks second -- which says more about Wednesday reader activity than about timing strategy.
Friday is a consistent underperformer at 19.0 avg reactions, 4.9% below the weekly average. Posting on Friday isn’t disqualifying, but it’s the one day where you’re working slightly against the trend.
The Dead Zone
Dead Zone
Posting between 06:00 and 08:00 UTC produced an average of 14.0 reactions per Note, 30% below the platform average. The worst single hour was 07:00 UTC at 13.6 avg reactions.
This is the cleanest avoidance signal in the data. No other window produces a gap this wide. The mechanism: 06:00–08:00 UTC falls between the two major audiences. It’s 1am–3am US East Coast (the primary Substack reader base is asleep) and 7am–9am CET (European readers are commuting, not engaged browsing). Notes posted in this slot sit in a quieter feed during their first few hours, and early engagement compounds -- a slow start means lower feed distribution, which means fewer reactions overall.
The counterintuitive trap: 07:00 UTC looks like a reasonable time to post if you’re thinking “European morning.” It’s not. The audience size at that hour can’t offset the lack of US afternoon engagement that Notes posted 12 hours later will capture. The avoidance is worth more than any other optimization in this article.
The Window
Recommended Window
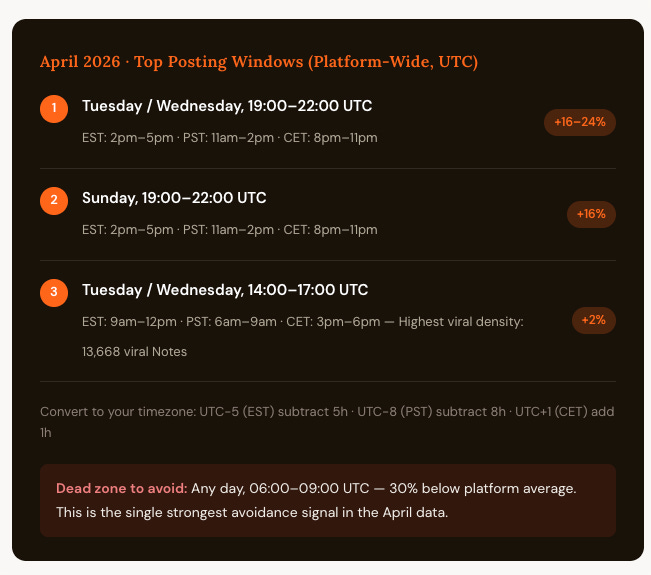
Tuesday or Wednesday, 19:00–22:00 UTC is the clearest intersection of the top-performing days and the top-performing hours. Estimated 20–24% above the platform’s weekly baseline when day and hour effects combine.
Crossing the day rankings against the hour rankings, one window stands out: Tuesday or Wednesday, 19:00–22:00 UTC. For US creators: 2pm–5pm EST / 11am–2pm PST. For European creators: 8pm–11pm CET. This window captures the maximum audience overlap, and Tuesday and Wednesday are both top-3 days for average engagement. Sunday 19:00–22:00 UTC works equally well as a weekend alternative -- same hour range, slightly different audience mix.
One extra note for creators optimizing for virality rather than average engagement. Hours 14:00–16:00 UTC produced the most viral Notes in April (3,741 viral Notes at 14:00 UTC alone, defined as 50+ reactions). That’s the US morning posting rush (EST: 9am–11am). Average reactions in that window are near the platform median, but the absolute viral count is highest because the posting volume is highest. More shots on goal. If you’re publishing something with real breakout potential, the midday window gives you the most chances to catch a spike.
The Caveat
This is platform-wide data from 789,362 Notes. It tells you when the average Substack reader is active -- not when your readers are active. A newsletter focused on European finance professionals, Asian developers, or US night-shift workers may behave nothing like this curve. The winning window for the platform average could be the dead zone for your audience.
If you have consistent posting history, your own engagement data is more valuable than these platform numbers. Look at which of your Notes got the most reactions in the first two hours after posting. That’s your actual optimal window. Use these platform findings as a starting hypothesis, not a fixed answer. And treat the dead zone (06:00–08:00 UTC) as a strong default avoidance unless your data specifically contradicts it.
How to Use This
Platform timing data changes. The winning window from April may shift in June as posting behavior and reader habits evolve -- which is why I run this analysis monthly. The most useful thing you can do with this data isn’t to post exactly at 21:00 UTC tomorrow. It’s to build a repeatable system: batch-schedule your Notes into these windows, compare your own stats against the platform baseline, and adjust quarterly. WriteStack’s scheduling grid lets you load a week of Notes into these slots in one pass, and the Stats dashboard shows your own hour-by-hour engagement so you can compare directly.
—
p.s.
In this article you can see the best times to post, based on general analysis of hundreds of thousands of notes.
In WriteStack, you can see your own personalized best time to post graph that shows when your audience is most active and when you should post your notes.